Table of Contents
Introduction
Managing observability across a growing infrastructure is challenging. The traditional approach involves deploying multiple agents per server:
- Prometheus for metrics collection
- Node Exporter for host metrics
- MySQL Exporter for database metrics
- Apache Exporter for web server metrics
- Promtail for log shipping
- OpenTelemetry Collector for traces
That's potentially 5-6 different agents per server, each with its own configuration, update cycle, and failure modes.
Grafana Alloy changes this paradigm by providing a single, unified agent that handles metrics, logs, and traces collection. In this guide, I'll walk you through building a production-ready monitoring stack from scratch.
Why Grafana Alloy?
Grafana Alloy (formerly Grafana Agent) is a vendor-agnostic OpenTelemetry Collector distribution with programmable pipelines. Here's what it replaces:
| Traditional Component | Alloy Equivalent |
|---|---|
| Prometheus (scraping only) | Built-in scraping |
| Node Exporter | prometheus.exporter.unix |
| MySQL Exporter | prometheus.exporter.mysql |
| Apache Exporter | prometheus.exporter.apache |
| Redis Exporter | prometheus.exporter.redis |
| Promtail | loki.source.file, loki.source.docker |
| OpenTelemetry Collector | Native OTLP support |
Key Benefits
- Single Binary: One agent to deploy, configure, and maintain
- River Configuration: Intuitive, declarative configuration language
- Built-in Service Discovery: Automatic target discovery for Kubernetes, Docker, EC2, etc.
- Lower Resource Footprint: Optimized for edge deployment
- Native Remote Write: Push metrics directly to Prometheus, Mimir, or Grafana Cloud
- Programmable Pipelines: Transform, filter, and route telemetry data
When NOT to Use Alloy
- You need local PromQL querying (use Prometheus directly)
- You're already running a well-optimized stack with no issues
- You need exporters that Alloy doesn't have built-in (though you can still scrape external exporters)
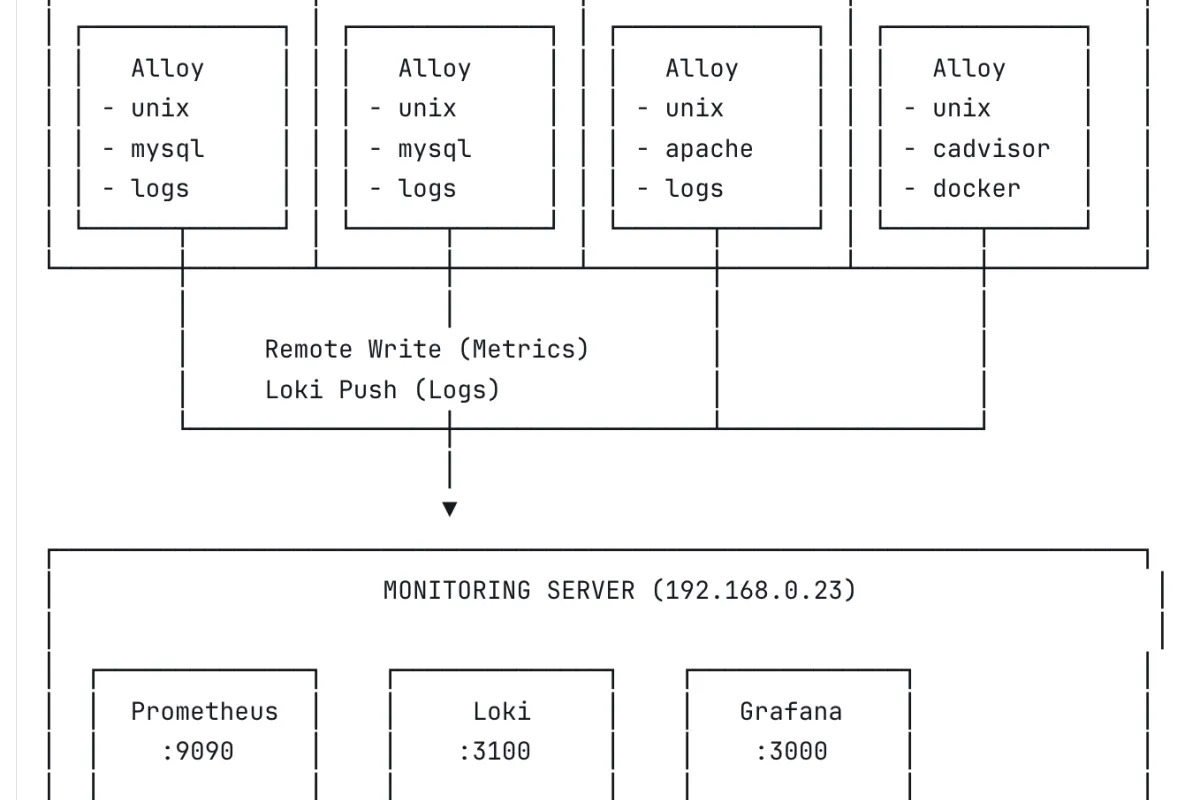
Data Flow
- Alloy runs on each target server
- Metrics are scraped locally and remote-written to Prometheus
- Logs are tailed and pushed to Loki
- Grafana queries both Prometheus and Loki for visualization
Prerequisites
Monitoring Server
- Ubuntu 22.04/24.04 LTS
- Docker and Docker Compose installed
- Minimum 2 CPU, 4GB RAM (for small deployments)
- 50GB+ disk for metrics and logs storage
Target Servers
- Ubuntu 20.04/22.04/24.04 LTS
- Network access to monitoring server (ports 9090, 3100)
- Root or sudo access
Network Requirements
| Source | Destination | Port | Protocol | Purpose |
|---|---|---|---|---|
| Alloy agents | Prometheus | 9090 | TCP | Metrics remote write |
| Alloy agents | Loki | 3100 | TCP | Log push |
| Admin | Grafana | 3000 | TCP | Web UI |
Part 1: Setting Up the Central Monitoring Server
1.1 Create Directory Structure
```
mkdir -p /opt/monitoring/{prometheus,loki,grafana/provisioning/datasources,alloy}
cd /opt/monitoring
```
1.2 Docker Compose Configuration
Create docker-compose.yml:
1.3 Prometheus Configuration
Create prometheus/prometheus.yml:
global:
  scrape_interval: 15s
  evaluation_interval: 15s

alerting:
  alertmanagers:
    - static_configs:
        - targets: []

rule_files: []

scrape_configs:
  - job_name: 'prometheus'
    static_configs:
      - targets: ['localhost:9090']
Key settings:
--web.enable-remote-write-receiver: Allows Alloy to push metrics--storage.tsdb.retention.time=30d: Keep 30 days of data--storage.tsdb.retention.size=40GB: Cap storage at 40GB
1.4 Loki Configuration
Create loki/loki-config.yml:
auth_enabled: false

server:
  http_listen_port: 3100
  grpc_listen_port: 9096

common:
  instance_addr: 127.0.0.1
  path_prefix: /loki
  storage:
    filesystem:
      chunks_directory: /loki/chunks
      rules_directory: /loki/rules
  replication_factor: 1
  ring:
    kvstore:
      store: inmemory

query_range:
  results_cache:
    cache:
      embedded_cache:
        enabled: true
        max_size_mb: 100

schema_config:
  configs:
    - from: 2020-10-24
      store: tsdb
      object_store: filesystem
      schema: v13
      index:
        prefix: index_
        period: 24h

ruler:
  alertmanager_url: http://localhost:9093

limits_config:
  retention_period: 30d
  ingestion_rate_mb: 10
  ingestion_burst_size_mb: 20
  max_streams_per_user: 10000
  max_line_size: 256kb

compactor:
  working_directory: /loki/compactor
  compaction_interval: 10m
  retention_enabled: true
  retention_delete_delay: 2h
  retention_delete_worker_count: 150
  delete_request_store: filesystem

analytics:
  reporting_enabled: false
Important: The delete_request_store: filesystem line is required when retention_enabled: true. Without it, Loki will fail to start.
1.5 Grafana Datasource Provisioning
Create grafana/provisioning/datasources/datasources.yml:
apiVersion: 1

datasources:
  - name: Prometheus
    type: prometheus
    access: proxy
    url: http://prometheus:9090
    isDefault: true
    editable: false

  - name: Loki
    type: loki
    access: proxy
    url: http://loki:3100
    editable: false
    jsonData:
      maxLines: 1000
1.6 Start the Stack
cd /opt/monitoring
docker compose up -d
1.7 Verify Installation
# Check all containers are running
docker compose ps

# Test Prometheus
curl -s http://localhost:9090/-/ready
# Expected: Prometheus Server is Ready.

# Test Loki (may take 15-30 seconds on first start)
curl -s http://localhost:3100/ready
# Expected: ready

# Test Grafana
curl -s http://localhost:3000/api/health
# Expected: {"commit":"...","database":"ok","version":"..."}
Access Grafana at http://YOUR_SERVER_IP:3000 with admin/changeme.
Part 2: Monitoring MySQL Database Servers
2.1 Install Alloy
Run on each MySQL server:
# Add Grafana repository
curl -fsSL https://apt.grafana.com/gpg.key | gpg --dearmor -o /usr/share/keyrings/grafana.gpg
echo "deb [signed-by=/usr/share/keyrings/grafana.gpg] https://apt.grafana.com stable main" | tee /etc/apt/sources.list.d/grafana.list

# Install Alloy
apt update && apt install alloy -y
2.2 Create MySQL Monitoring User
Connect to MySQL and create a dedicated monitoring user:
CREATE USER 'alloy'@'localhost' IDENTIFIED BY 'your_secure_password_here';
GRANT PROCESS, REPLICATION CLIENT, SELECT ON *.* TO 'alloy'@'localhost';
FLUSH PRIVILEGES;
Permissions explained:
- PROCESS: View running queries and connections
- REPLICATION CLIENT: View replication status
- SELECT: Read table statistics
2.3 Configure Alloy
Create /etc/alloy/config.alloy:
// =============================================================================
// ALLOY CONFIGURATION FOR MYSQL SERVER
// Server: mysql-01 (change for each server)
// =============================================================================

// -----------------------------------------------------------------------------
// NODE/HOST METRICS
// Replaces: node_exporter
// -----------------------------------------------------------------------------
prometheus.exporter.unix "node" { }

prometheus.scrape "node" {
  targets    = prometheus.exporter.unix.node.targets
  forward_to = [prometheus.relabel.add_labels.receiver]

  scrape_interval = "15s"
}

// -----------------------------------------------------------------------------
// MYSQL METRICS
// Replaces: mysqld_exporter
// -----------------------------------------------------------------------------
prometheus.exporter.mysql "database" {
  data_source_name = "alloy:your_secure_password_here@(localhost:3306)/"
}

prometheus.scrape "mysql" {
  targets    = prometheus.exporter.mysql.database.targets
  forward_to = [prometheus.relabel.add_labels.receiver]

  scrape_interval = "15s"
}

// -----------------------------------------------------------------------------
// LABELS
// Add consistent labels to all metrics
// -----------------------------------------------------------------------------
prometheus.relabel "add_labels" {
  rule {
    action       = "replace"
    target_label = "server"
    replacement  = "mysql-01"  // CHANGE THIS FOR EACH SERVER
  }

  rule {
    action       = "replace"
    target_label = "environment"
    replacement  = "production"
  }

  forward_to = [prometheus.remote_write.default.receiver]
}

// -----------------------------------------------------------------------------
// REMOTE WRITE TO PROMETHEUS
// -----------------------------------------------------------------------------
prometheus.remote_write "default" {
  endpoint {
    url = "http://192.168.0.23:9090/api/v1/write"

    queue_config {
      max_samples_per_send = 1000
      batch_send_deadline  = "5s"
      min_backoff          = "30ms"
      max_backoff          = "5s"
    }
  }
}

// -----------------------------------------------------------------------------
// LOG COLLECTION
// Replaces: promtail
// -----------------------------------------------------------------------------
loki.source.file "mysql_logs" {
  targets = [
    {
      __path__  = "/var/log/mysql/error.log",
      job       = "mysql-error",
      server    = "mysql-01",
      component = "mysql",
    },
    {
      __path__  = "/var/log/mysql/mysql-slow.log",
      job       = "mysql-slow",
      server    = "mysql-01",
      component = "mysql",
    },
  ]
  forward_to = [loki.write.default.receiver]
}

loki.source.file "system_logs" {
  targets = [
    {
      __path__ = "/var/log/syslog",
      job      = "syslog",
      server   = "mysql-01",
    },
    {
      __path__ = "/var/log/auth.log",
      job      = "authlog",
      server   = "mysql-01",
    },
  ]
  forward_to = [loki.write.default.receiver]
}

// -----------------------------------------------------------------------------
// LOKI WRITE
// -----------------------------------------------------------------------------
loki.write "default" {
  endpoint {
    url = "http://192.168.0.23:3100/loki/api/v1/push"

    batch_wait   = "1s"
    batch_size   = 1048576  // 1MB
  }
}
2.4 Configure Permissions
# Allow Alloy to read log files
usermod -aG adm alloy
usermod -aG mysql alloy

# Verify permissions
su - alloy -s /bin/bash -c "cat /var/log/mysql/error.log | head -1"
2.5 Start Alloy
systemctl enable alloy
systemctl start alloy

# Check status
systemctl status alloy

# View logs
journalctl -u alloy -f --no-pager
2.6 Verify Data Collection
# Check metrics are being scraped
curl -s http://localhost:12345/metrics | grep mysql_up

# Check data is reaching Prometheus (run from monitoring server)
curl -s 'http://192.168.0.23:9090/api/v1/query?query=mysql_up' | jq '.data.result[].metric.server'
Part 3: Monitoring Apache + PHP-FPM Web Servers
3.1 Install Alloy
curl -fsSL https://apt.grafana.com/gpg.key | gpg --dearmor -o /usr/share/keyrings/grafana.gpg
echo "deb [signed-by=/usr/share/keyrings/grafana.gpg] https://apt.grafana.com stable main" | tee /etc/apt/sources.list.d/grafana.list
apt update && apt install alloy -y
3.2 Enable Apache Server Status
Enable the status module:
a2enmod status Create a dedicated vhost for status endpoints. This is important if you're running Laravel or any framework that catches all routes.
Create /etc/apache2/sites-available/000-localhost-status.conf:
    ServerName 127.0.0.1

    # Apache server status

        SetHandler server-status
        Require local


    # PHP-FPM status (optional)

        SetHandler "proxy:unix:/run/php/php8.1-fpm.sock|fcgi://localhost/status"
        Require local
Enable the vhost:
a2enmod proxy proxy_fcgi
a2ensite 000-localhost-status
systemctl restart apache2
The 000- prefix ensures this vhost loads first, before your application vhosts.
Verify:
curl http://127.0.0.1/server-status?auto 3.3 Enable PHP-FPM Status (Optional)
Edit /etc/php/8.1/fpm/pool.d/www.conf:
pm.status_path = /status Restart PHP-FPM:
systemctl restart php8.1-fpm Verify:
curl http://127.0.0.1/status 3.4 Configure Alloy
Create /etc/alloy/config.alloy:
// =============================================================================
// ALLOY CONFIGURATION FOR WEB SERVER
// Server: web-server
// =============================================================================

// -----------------------------------------------------------------------------
// NODE/HOST METRICS
// -----------------------------------------------------------------------------
prometheus.exporter.unix "node" { }

prometheus.scrape "node" {
  targets    = prometheus.exporter.unix.node.targets
  forward_to = [prometheus.relabel.add_labels.receiver]
}

// -----------------------------------------------------------------------------
// APACHE METRICS
// Replaces: apache_exporter
// -----------------------------------------------------------------------------
prometheus.exporter.apache "web" {
  scrape_uri = "http://127.0.0.1/server-status?auto"
}

prometheus.scrape "apache" {
  targets    = prometheus.exporter.apache.web.targets
  forward_to = [prometheus.relabel.add_labels.receiver]
}

// -----------------------------------------------------------------------------
// LABELS
// -----------------------------------------------------------------------------
prometheus.relabel "add_labels" {
  rule {
    action       = "replace"
    target_label = "server"
    replacement  = "web-server"
  }

  rule {
    action       = "replace"
    target_label = "environment"
    replacement  = "production"
  }

  forward_to = [prometheus.remote_write.default.receiver]
}

// -----------------------------------------------------------------------------
// REMOTE WRITE
// -----------------------------------------------------------------------------
prometheus.remote_write "default" {
  endpoint {
    url = "http://192.168.0.23:9090/api/v1/write"
  }
}

// -----------------------------------------------------------------------------
// LOG COLLECTION
// -----------------------------------------------------------------------------
loki.source.file "system_logs" {
  targets = [
    {__path__ = "/var/log/syslog", job = "syslog", server = "web-server"},
    {__path__ = "/var/log/auth.log", job = "authlog", server = "web-server"},
  ]
  forward_to = [loki.write.default.receiver]
}

loki.source.file "apache_logs" {
  targets = [
    {__path__ = "/var/log/apache2/access.log", job = "apache-access", server = "web-server"},
    {__path__ = "/var/log/apache2/error.log", job = "apache-error", server = "web-server"},
    {__path__ = "/var/log/apache2/*-access.log", job = "apache-access", server = "web-server"},
    {__path__ = "/var/log/apache2/*-error.log", job = "apache-error", server = "web-server"},
  ]
  forward_to = [loki.write.default.receiver]
}

loki.source.file "php_logs" {
  targets = [
    {__path__ = "/var/log/php*.log", job = "php-fpm", server = "web-server"},
  ]
  forward_to = [loki.write.default.receiver]
}

// -----------------------------------------------------------------------------
// LOKI WRITE
// -----------------------------------------------------------------------------
loki.write "default" {
  endpoint {
    url = "http://192.168.0.23:3100/loki/api/v1/push"
  }
}
3.5 Start Alloy
usermod -aG adm alloy
usermod -aG www-data alloy
systemctl enable alloy
systemctl start alloy
Part 4: Monitoring Docker Container Hosts
4.1 Install Alloy
curl -fsSL https://apt.grafana.com/gpg.key | gpg --dearmor -o /usr/share/keyrings/grafana.gpg
echo "deb [signed-by=/usr/share/keyrings/grafana.gpg] https://apt.grafana.com stable main" | tee /etc/apt/sources.list.d/grafana.list
apt update && apt install alloy -y
4.2 Deploy cAdvisor
Alloy's built-in cAdvisor exporter can have permission issues with Docker's overlay filesystem. The reliable solution is running cAdvisor as a privileged container:
docker run -d \
  --name=cadvisor \
  --restart=unless-stopped \
  --privileged \
  -p 8081:8080 \
  -v /:/rootfs:ro \
  -v /var/run:/var/run:ro \
  -v /sys:/sys:ro \
  -v /var/lib/docker/:/var/lib/docker:ro \
  gcr.io/cadvisor/cadvisor:latest
Note: Use port 8081 if 8080 is already in use.
Verify:
curl -s http://localhost:8081/metrics | grep container_cpu 4.3 Configure Alloy
Create /etc/alloy/config.alloy:
// =============================================================================
// ALLOY CONFIGURATION FOR DOCKER HOST
// Server: docker-host
// =============================================================================

// -----------------------------------------------------------------------------
// NODE/HOST METRICS
// -----------------------------------------------------------------------------
prometheus.exporter.unix "node" { }

prometheus.scrape "node" {
  targets    = prometheus.exporter.unix.node.targets
  forward_to = [prometheus.relabel.add_labels.receiver]
}

// -----------------------------------------------------------------------------
// CADVISOR (CONTAINER METRICS)
// -----------------------------------------------------------------------------
prometheus.scrape "cadvisor" {
  targets = [
    {"__address__" = "localhost:8081", "job" = "cadvisor"},
  ]
  forward_to = [prometheus.relabel.add_labels.receiver]

  scrape_interval = "15s"
  scrape_timeout  = "10s"
}

// -----------------------------------------------------------------------------
// LABELS
// -----------------------------------------------------------------------------
prometheus.relabel "add_labels" {
  rule {
    action       = "replace"
    target_label = "server"
    replacement  = "docker-host"
  }

  forward_to = [prometheus.remote_write.default.receiver]
}

// -----------------------------------------------------------------------------
// REMOTE WRITE
// -----------------------------------------------------------------------------
prometheus.remote_write "default" {
  endpoint {
    url = "http://192.168.0.23:9090/api/v1/write"
  }
}

// -----------------------------------------------------------------------------
// SYSTEM LOGS
// -----------------------------------------------------------------------------
loki.source.file "system_logs" {
  targets = [
    {__path__ = "/var/log/syslog", job = "syslog", server = "docker-host"},
    {__path__ = "/var/log/auth.log", job = "authlog", server = "docker-host"},
  ]
  forward_to = [loki.write.default.receiver]
}

// -----------------------------------------------------------------------------
// DOCKER CONTAINER LOGS
// Automatically discovers and collects logs from all containers
// -----------------------------------------------------------------------------
discovery.docker "containers" {
  host = "unix:///var/run/docker.sock"
}

loki.source.docker "containers" {
  host       = "unix:///var/run/docker.sock"
  targets    = discovery.docker.containers.targets
  labels     = {server = "docker-host", job = "docker"}
  forward_to = [loki.write.default.receiver]

  refresh_interval = "5s"
}

// -----------------------------------------------------------------------------
// LOKI WRITE
// -----------------------------------------------------------------------------
loki.write "default" {
  endpoint {
    url = "http://192.168.0.23:3100/loki/api/v1/push"
  }
}
4.4 Start Alloy
usermod -aG docker alloy
usermod -aG adm alloy
systemctl enable alloy
systemctl start alloy
Part 5: Creating Grafana Dashboards
5.1 Dashboard Variables
Before creating panels, set up a server variable for filtering:
- Open your dashboard
- Go to Settings → Variables → New variable
- Configure:
- Name: server
- Type: Query
- Data source: Prometheus
- Query:
label_values(up, server) - Multi-value: Enable
- Include All option: Enable
- Click Apply
Now use {server=~"$server"} in all your queries.
5.2 Key Metrics Reference
Host Metrics (Node Exporter)
# CPU Usage (%)
100 - (avg by(server) (rate(node_cpu_seconds_total{mode="idle", server=~"$server"}[5m])) * 100)

# Memory Usage (%)
(node_memory_MemTotal_bytes{server=~"$server"} - node_memory_MemAvailable_bytes{server=~"$server"}) / node_memory_MemTotal_bytes{server=~"$server"} * 100

# Disk Usage (%)
100 - (node_filesystem_avail_bytes{server=~"$server", mountpoint="/"} / node_filesystem_size_bytes{server=~"$server", mountpoint="/"} * 100)

# Load Average
node_load1{server=~"$server"}
node_load5{server=~"$server"}
node_load15{server=~"$server"}

# Network Traffic
rate(node_network_receive_bytes_total{server=~"$server", device!="lo"}[5m])
rate(node_network_transmit_bytes_total{server=~"$server", device!="lo"}[5m])

# Disk I/O
rate(node_disk_read_bytes_total{server=~"$server"}[5m])
rate(node_disk_written_bytes_total{server=~"$server"}[5m])
MySQL Metrics
# MySQL Up/Down
mysql_up{server=~"$server"}

# Connections
mysql_global_status_threads_connected{server=~"$server"}
mysql_global_variables_max_connections{server=~"$server"}

# Queries per Second
rate(mysql_global_status_queries{server=~"$server"}[5m])

# Slow Queries per Second
rate(mysql_global_status_slow_queries{server=~"$server"}[5m])

# Buffer Pool Hit Rate
1 - (rate(mysql_global_status_innodb_buffer_pool_reads{server=~"$server"}[5m]) / rate(mysql_global_status_innodb_buffer_pool_read_requests{server=~"$server"}[5m]))

# InnoDB Buffer Pool Usage
mysql_global_status_innodb_buffer_pool_bytes_data{server=~"$server"}
mysql_global_variables_innodb_buffer_pool_size{server=~"$server"}
Apache Metrics
# Apache Up/Down
apache_up{server=~"$server"}

# Requests per Second
rate(apache_accesses_total{server=~"$server"}[5m])

# Traffic (Bytes/sec)
rate(apache_sent_kilobytes_total{server=~"$server"}[5m]) * 1024

# Workers
apache_workers{server=~"$server", state="busy"}
apache_workers{server=~"$server", state="idle"}

# Uptime
apache_uptime_seconds_total{server=~"$server"}
Docker/Container Metrics
# Container CPU Usage
rate(container_cpu_usage_seconds_total{server=~"$server", name!=""}[5m]) * 100

# Container Memory Usage
container_memory_usage_bytes{server=~"$server", name!=""}

# Container Network I/O
rate(container_network_receive_bytes_total{server=~"$server", name!=""}[5m])
rate(container_network_transmit_bytes_total{server=~"$server", name!=""}[5m])

# Running Containers Count
count(container_memory_usage_bytes{server=~"$server", name!=""})
5.3 Sample Dashboard JSON
Here's a complete MySQL dashboard you can import:
{
  "title": "MySQL Overview",
  "uid": "mysql-overview",
  "templating": {
    "list": [{
      "name": "server",
      "type": "query",
      "datasource": "Prometheus",
      "query": "label_values(mysql_up, server)",
      "refresh": 2,
      "multi": true,
      "includeAll": true
    }]
  },
  "panels": [
    {
      "title": "MySQL Status",
      "type": "stat",
      "gridPos": {"h": 4, "w": 4, "x": 0, "y": 0},
      "targets": [{"expr": "mysql_up{server=~\"$server\"}", "legendFormat": "{{server}}"}],
      "fieldConfig": {
        "defaults": {
          "mappings": [
            {"options": {"0": {"text": "DOWN", "color": "red"}}, "type": "value"},
            {"options": {"1": {"text": "UP", "color": "green"}}, "type": "value"}
          ]
        }
      }
    },
    {
      "title": "Queries per Second",
      "type": "timeseries",
      "gridPos": {"h": 8, "w": 12, "x": 4, "y": 0},
      "targets": [{"expr": "rate(mysql_global_status_queries{server=~\"$server\"}[5m])", "legendFormat": "{{server}}"}]
    },
    {
      "title": "Connections",
      "type": "timeseries",
      "gridPos": {"h": 8, "w": 8, "x": 16, "y": 0},
      "targets": [
        {"expr": "mysql_global_status_threads_connected{server=~\"$server\"}", "legendFormat": "{{server}} - Connected"},
        {"expr": "mysql_global_variables_max_connections{server=~\"$server\"}", "legendFormat": "{{server}} - Max"}
      ]
    }
  ],
  "schemaVersion": 38,
  "time": {"from": "now-1h", "to": "now"},
  "refresh": "30s"
}
Part 6: Alerting Configuration
6.1 Prometheus Alerting Rules
Create prometheus/alerts.yml:
groups:
  - name: host
    rules:
      - alert: HostDown
        expr: up == 0
        for: 1m
        labels:
          severity: critical
        annotations:
          summary: "Host {{ $labels.server }} is down"
          description: "{{ $labels.server }} has been unreachable for more than 1 minute."

      - alert: HighCPU
        expr: 100 - (avg by(server) (rate(node_cpu_seconds_total{mode="idle"}[5m])) * 100) > 80
        for: 5m
        labels:
          severity: warning
        annotations:
          summary: "High CPU usage on {{ $labels.server }}"
          description: "CPU usage is above 80% (current: {{ $value | printf \"%.1f\" }}%)"

      - alert: HighMemory
        expr: (node_memory_MemTotal_bytes - node_memory_MemAvailable_bytes) / node_memory_MemTotal_bytes * 100 > 85
        for: 5m
        labels:
          severity: warning
        annotations:
          summary: "High memory usage on {{ $labels.server }}"

      - alert: DiskSpaceLow
        expr: 100 - (node_filesystem_avail_bytes{mountpoint="/"} / node_filesystem_size_bytes{mountpoint="/"} * 100) > 85
        for: 5m
        labels:
          severity: warning
        annotations:
          summary: "Low disk space on {{ $labels.server }}"

  - name: mysql
    rules:
      - alert: MySQLDown
        expr: mysql_up == 0
        for: 1m
        labels:
          severity: critical
        annotations:
          summary: "MySQL is down on {{ $labels.server }}"

      - alert: MySQLTooManyConnections
        expr: mysql_global_status_threads_connected / mysql_global_variables_max_connections > 0.8
        for: 5m
        labels:
          severity: warning
        annotations:
          summary: "MySQL connections above 80% on {{ $labels.server }}"

      - alert: MySQLSlowQueries
        expr: rate(mysql_global_status_slow_queries[5m]) > 1
        for: 5m
        labels:
          severity: warning
        annotations:
          summary: "MySQL slow queries detected on {{ $labels.server }}"

  - name: apache
    rules:
      - alert: ApacheDown
        expr: apache_up == 0
        for: 1m
        labels:
          severity: critical
        annotations:
          summary: "Apache is down on {{ $labels.server }}"
Troubleshooting Guide
Alloy Won't Start
Check config syntax:
alloy fmt /etc/alloy/config.alloy Run manually to see errors:
alloy run /etc/alloy/config.alloy Common errors:
component "xxx" does not exist: The exporter isn't available in Alloypermission denied: Runusermod -aGand restartalloy
No Data in Grafana
Check if Alloy is scraping:
curl -s http://localhost:12345/metrics | grep -c "^[a-z]" Check if Prometheus is receiving:
curl -s 'http://PROMETHEUS_IP:9090/api/v1/query?query=up' | jq '.data.result[].metric.server' Check Alloy logs:
journalctl -u alloy -f --no-pager Loki "Ingester Not Ready"
This is normal on first start. Wait 15-30 seconds:
watch -n 5 'curl -s http://localhost:3100/ready' Permission Denied on Logs
# Check current groups
groups alloy

# Add to required groups
usermod -aG adm alloy      # System logs
usermod -aG mysql alloy    # MySQL logs
usermod -aG www-data alloy # Apache logs
usermod -aG docker alloy   # Docker socket

# Restart
systemctl restart alloy
High Memory Usage
Alloy can consume significant memory with many targets. Tune the config:
prometheus.remote_write "default" {
  endpoint {
    url = "http://prometheus:9090/api/v1/write"

    queue_config {
      max_samples_per_send = 500    # Reduce from default 2000
      capacity             = 2500   # Reduce from default 10000
      max_shards           = 10     # Limit parallelism
    }
  }
}
Performance Tuning
Prometheus Storage
For longer retention or higher cardinality:
command:
  - '--storage.tsdb.retention.time=90d'
  - '--storage.tsdb.retention.size=100GB'
  - '--storage.tsdb.wal-compression'
  - '--storage.tsdb.max-block-duration=2h'
Loki Optimization
For high-volume log ingestion:
limits_config:
  ingestion_rate_mb: 20
  ingestion_burst_size_mb: 40
  per_stream_rate_limit: 5MB
  per_stream_rate_limit_burst: 15MB
Alloy Resource Limits
Create /etc/systemd/system/alloy.service.d/limits.conf:
[Service]
MemoryMax=512M
CPUQuota=50%
systemctl daemon-reload
systemctl restart alloy
Conclusion
We've built a complete monitoring stack that:
- Collects metrics from hosts, MySQL, Apache, and Docker containers
- Aggregates logs from all sources into Loki
- Visualizes everything in Grafana dashboards
- Uses a single agent (Alloy) per server instead of multiple exporters
Key Takeaways
- Alloy simplifies operations by consolidating multiple agents
- Remote write eliminates the need for Prometheus to scrape targets
- Consistent labeling (server, environment) enables powerful filtering
- Docker Compose makes the central stack portable and reproducible
Next Steps
- Add Alertmanager for alert routing and notifications
- Implement Tempo for distributed tracing
- Scale to Mimir for long-term metrics storage
- Set up recording rules for complex/expensive queries